
Mastering WordPress Performance: Automated Monitoring Tools and Scripts (2025 Edition)
TL;DR: Automated monitoring of your WordPress site’s uptime and speed is essential in 2025—not just for performance, but for SEO, user experience, and brand trust. This guide outlines three core monitoring approaches:
-
External SaaS tools (GTmetrix, UptimeRobot, New Relic, etc.) for outside-in checks of site availability and synthetic performance from various locations.
-
WordPress plugins (Performance Monitor, WP Umbrella, Query Monitor, etc.) for inside-out visibility, tracking historical performance, error detection, and integrating into your WP dashboard.
-
DIY / self-hosted solutions (bash scripts with cron jobs, server monitoring tools like Zabbix or Nagios) for full control, cost efficiency, and custom workflows—at the cost of more setup and maintenance.
Using these tools, the guide also delivers a framework for diagnosing performance issues (front-end, back-end), choosing the right monitoring stack based on site scale and technical ability (blogger → eCommerce → agency), and tips for reacting proactively rather than waiting for problems.
Table of Contents
- Introduction: Why Your Site’s Pulse Matters More Than Ever in 2025
- The “Why”: How Automated Monitoring Directly Impacts WordPress Success
- The Monitoring Landscape: Choosing Your WordPress Watchdog
- Deep Dive: External Performance & Uptime Monitoring Tools (SaaS)
- Deep Dive: WordPress Monitoring Plugins
- Deep Dive: Advanced & DIY Monitoring
- From Data to Action: Troubleshooting with Monitoring Tools
- A Decision Framework for WordPress Owners
- The Future of WordPress Monitoring: AI and Integrated Observability
- Conclusion: Turn Monitoring into Your Competitive Advantage
- Frequently Asked Questions (FAQ)
What is WordPress Automated Monitoring Tools and Scripts?
WordPress site’s speed and uptime aren’t just tech specs—they’re vital lifelines for user experience, SEO, and trust. Whether you’re a solo blogger, a growing eCommerce venture, or an agency managing dozens of client sites, knowing when your site slows down or goes offline is no longer optional—it’s essential. This post dives into the tools, scripts, and methods that automate monitoring so you can catch problems before they catch your visitors, protect your rankings, and ensure your site stays fast, reliable, and always available.
Why Choosing the Best WordPress Hosting Providers Matters: Performance & Support
Choosing a high-quality WordPress hosting provider can make all the difference. The right host sets the foundation for uptime, speed, and consistency—and paired with good support, it gives you peace of mind. Below are the key benefits of investing in the best hosting in terms of Performance and Support:
-
Faster Load Times
Premium hosts often use better hardware (SSD storage, fast CPUs), optimized server configurations, and caching layers. This means your pages render faster, reducing bounce rates and improving Core Web Vitals scores. -
Higher Uptime Reliability
Top hosts typically offer strong infrastructure, redundancy (power, network), and monitoring so that downtime is minimal. Consistent uptime ensures visitors always have access, which also signals reliability to search engines. -
Scalability & Resource Allocation
Good hosts allow you to scale up (bandwidth, CPU, memory) when traffic spikes. You won’t suffer slowdowns just because you suddenly got more visitors, dealt with sales campaigns, or launched new features. -
Better Security & Maintenance
The best hosts include security features like malware scanning, firewalls, automated backups, and even patching. This reduces risks of hacks or performance-degrading security issues. -
Expert Support When You Need It
Having responsive, knowledgeable support means issues get resolved fast—whether it’s a server mis-configuration, plugin conflict, or a performance anomaly. Time saved troubleshooting is time invested in growing your site. -
Optimized Configurations Out of the Box
Top hosts often provide server-side caching, optimized PHP versions, HTTP/2 or HTTP/3, and content delivery network (CDN) integrations. These optimizations, if available, save you from doing all the heavy lifting yourself. -
Peace of Mind & Focus on Growth
When your hosting provider is reliable and your site is fast, you can focus on content, marketing, and features rather than firefighting performance problems. That lets your business grow sustainably and confidently.
Why Your Site’s Pulse Matters More Than Ever in 2025
In the digital economy of 2025, your website’s performance is not a feature; it is the foundation of your online presence. The data is unequivocal: a mere one-second delay in page load time can slash conversions by 7%, and 53% of mobile users will abandon a site that takes longer than three seconds to load, according to a study by Portent WP Engine, . For businesses, downtime is even more catastrophic. A 2024 study by Enterprise Management Associates calculated the average cost of unplanned downtime at a staggering $14,056 per minute .
This reality is amplified within the WordPress ecosystem. With WordPress now powering over 43.4% of all websites globally , the competition for user attention and search engine visibility has become a fierce battleground where milliseconds matter. In this environment, manually checking your site’s health is not just inefficient; it’s impossible. The real risk isn’t just having a slow site; it’s the silent erosion of revenue and reputation that occurs when you don’t know *when* or *why* your site is underperforming.
This guide is the definitive 2025 resource for WordPress owners, developers, and agencies to master *automated* performance and uptime monitoring. We will move beyond abstract theory and provide actionable, step-by-step instructions to establish a robust, 24/7 monitoring system. You will learn to interpret the data it provides, make informed decisions, and transform your website from a potential liability into a high-performing asset that boosts your search rankings, enhances user experience, and drives your bottom line.
By the end of this report, you will have a clear framework for selecting, implementing, and leveraging the right tools and scripts to ensure your WordPress site is not just online, but consistently fast, reliable, and ready for success.
The “Why”: How Automated Monitoring Directly Impacts WordPress Success
Viewing website monitoring as a mere technical chore is a critical mistake in 2025. It is a fundamental business strategy with a direct, measurable impact on your success. For a WordPress site, this impact manifests across four crucial pillars: search engine visibility, user experience, operational efficiency, and brand integrity.
Google Rankings & Core Web Vitals: The Unblinking Eye of Search
Since the full rollout of the Page Experience update, Google has made it clear that user experience is a direct ranking factor. The most tangible expression of this is the Core Web Vitals (CWV), a set of specific metrics that measure real-world user experience for loading performance, interactivity, and visual stability.
- Largest Contentful Paint (LCP): Measures loading performance. To provide a good user experience, sites should strive to have LCP occur within 2.5 seconds of when the page first starts loading.
- Interaction to Next Paint (INP): Measures interactivity. A page’s responsiveness is critical, and a good INP is considered to be 200 milliseconds or less.
- Cumulative Layout Shift (CLS): Measures visual stability. A good user experience maintains a CLS of 0.1 or less.
Google uses actual user data from the Chrome User Experience Report (CrUX) to assess these vitals . A plugin update, a new third-party script, or a server issue can degrade these scores overnight, silently damaging your SEO. Automated monitoring is the only reliable way to continuously track these metrics, get alerted to regressions, and proactively protect your search rankings.
User Experience (UX) & Conversions: The High Cost of Waiting
A slow or unavailable website is the ultimate user experience killer. Research consistently shows that user patience is incredibly thin. A site that loads in one second has a conversion rate three times higher than a site that loads in five seconds . This isn’t just about bounce rates; it’s about tangible revenue loss. For an eCommerce store, a slow checkout process leads to abandoned carts. For a publisher, slow page loads mean fewer articles read and lower ad impressions. Automated monitoring helps you maintain a consistently fast and reliable experience, which builds user trust and directly translates to higher conversions, more sales, and greater engagement.
Proactive vs. Reactive Troubleshooting: From Firefighting to Prevention
Without automated monitoring, your troubleshooting process is inherently reactive. It begins when a customer complains on social media or sends an angry email saying, “;Your site is down!” By then, the damage to your reputation and revenue has already been done. Automated monitoring fundamentally shifts this paradigm from reactive firefighting to proactive prevention.
- Reactive: “A user reported my site is down. I need to investigate now.”
- Proactive: “I received an automated alert that my server’s Time to First Byte (TTFB) spiked by 300ms. I can investigate and fix the issue before most users even notice.”
This proactive stance, enabled by tools that check your site every minute from global locations, is the hallmark of a professionally managed website. It allows you to identify and resolve issues like plugin conflicts, server resource exhaustion, or third-party service outages before they escalate into major incidents .
Protecting Your Brand Reputation: The First Line of Defense
Your website is often the first interaction a potential customer has with your brand. Frequent downtime, slow performance, or security warnings (like an expired SSL certificate) erode credibility and trust. A 2025 survey revealed that 70% of consumers would abandon a brand after two poor digital experiences . Automated monitoring acts as your first line of defense, ensuring your digital storefront is always open, fast, and secure. It’s an investment in the reliability and professionalism that users expect.
The Monitoring Landscape: Choosing Your WordPress Watchdog
Before diving into specific tools, it’s crucial to understand the three primary approaches to automated monitoring. Each has distinct advantages, disadvantages, and ideal use cases. Choosing the right path—or a combination of paths—is the first step toward building an effective monitoring strategy for your WordPress site.
Approach 1: External SaaS Tools (The Specialists)
These are third-party services that monitor your website from their own global network of servers. They simulate real visitor experiences by sending requests to your site at regular intervals. This “outside-in” approach is their greatest strength.
- How it works: You provide your URL, and the service (e.g., GTmetrix, UptimeRobot) pings your site from locations like London, Dallas, or Sydney. If your server is slow to respond or returns an error, the service sends you an alert.
- Key Advantage: Because they operate externally, they can detect total outages where your server is completely offline. A plugin-based monitor, which runs on your server, cannot alert you if the server itself has crashed. They also place zero performance overhead on your WordPress site.
- Best For: Virtually all websites, especially businesses where uptime and global performance are critical. They are the most reliable source for uptime and synthetic performance data.
Approach 2: WordPress Plugins (The Integrators)
These tools operate from within your WordPress installation, bringing monitoring data directly into your admin dashboard. Their primary appeal is convenience and deep integration with the WordPress environment.
- How it works: A plugin like Performance Monitor uses your server to make API calls to services like Google PageSpeed Insights and stores the results in your database. Others, like WP Umbrella, act as an agent that reports data back to a central dashboard.
- Key Advantage: Unmatched convenience. You can view performance trends, uptime history, and even server health stats without leaving your WordPress backend. Some plugins can provide context that external tools can’t, such as identifying which specific plugin is causing a PHP error.
- Best For: Beginners, non-technical users, and anyone who values the convenience of a single, integrated dashboard. They are excellent for tracking historical performance trends.
Approach 3: Custom Scripts & Self-Hosted Solutions (The DIY Powerhouse)
This is the most advanced approach, offering ultimate control and customization. It involves writing your own monitoring scripts or deploying open-source monitoring platforms on your own server.
- How it works: A developer writes a simple Bash script that uses `curl` to check a site’s HTTP status and sets it to run every few minutes via a cron job . Alternatively, they might install a powerful open-source tool like Zabbix or Nagios to monitor the entire server infrastructure (CPU, RAM, network traffic).
- Key Advantage: Complete control and zero subscription fees. You can tailor the monitoring logic to your exact needs, integrate with any notification system, and retain all data in-house.
- Best For: Developers, agencies with specific technical requirements, and organizations with strict data privacy policies or limited budgets for SaaS tools.
Comparison Table: Monitoring Approaches
| Feature | External SaaS Tools | WordPress Plugins | Custom Scripts / Self-Hosted |
|---|---|---|---|
| Best For | All user levels, especially businesses needing reliability & global checks. | Beginners, non-technical users, those wanting a single dashboard. | Developers, agencies, users with specific needs & technical skills. |
| Pros | Highly reliable, global test locations, no impact on site performance, advanced features (APM, RUM). | Easy to install/configure, integrated into WP dashboard, often multi-functional. | Full control, no subscription fees, highly customizable, total data ownership. |
| Cons | Can be expensive at scale, data is outside your ecosystem, potential for false positives from network issues. | Can add overhead to your site, relies on your server to run, may miss server-level outages. | High setup/maintenance effort, requires significant technical expertise, risk of misconfiguration. |
| Example | GTmetrix, UptimeRobot, New Relic | WP Umbrella, Performance Monitor, Jetpack | Bash script via Cron, Zabbix, Nagios |
Deep Dive: External Performance & Uptime Monitoring Tools (SaaS)
External Software-as-a-Service (SaaS) tools are the cornerstone of a professional WordPress monitoring strategy. They provide an objective, outside-in perspective on your site’s availability and performance, simulating how real users and search engine crawlers experience your site from around the world.
Introduction to External Monitoring: Lab vs. Field Data
When using external tools, it’s vital to understand the two types of data they provide:
- Lab Data (Synthetic Monitoring): This is data collected in a controlled, consistent environment. When GTmetrix tests your site from its Vancouver server with a specific connection speed, it’;s generating lab data. This is excellent for consistent, repeatable testing, debugging issues, and tracking changes after an optimization. It answers the question: “How does my site perform under these specific conditions?”
- Field Data (Real User Monitoring – RUM): This is data collected from actual, anonymous users visiting your site in the wild. Google’;s Chrome User Experience (CrUX) report is the most prominent source of field data. It captures the performance experienced by real people on various devices, networks, and locations. This data is what Google uses for its Core Web Vitals ranking signal. It answers the question: “How is my site *actually* performing for my real visitors?”
The best tools, like Google PageSpeed Insights, leverage both. They show you the lab data to help you diagnose problems and the field data to show you how you’re measuring up in the real world .
Tool-by-Tool Breakdown
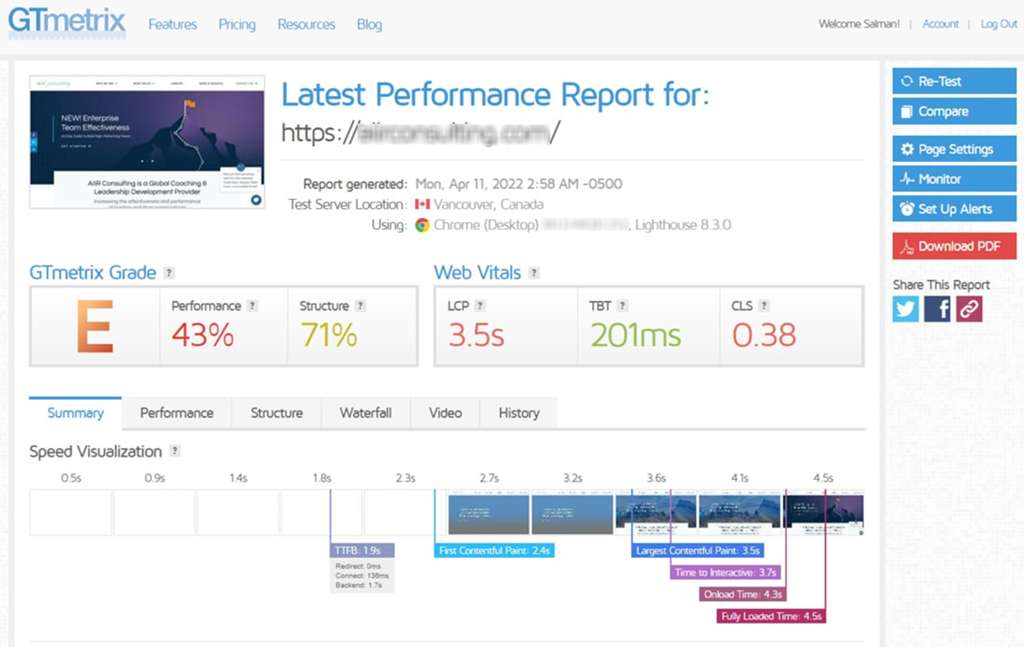
GTmetrix: The Performance Analyst’s Toolkit
GTmetrix is a favorite among developers and performance enthusiasts for its detailed analysis and actionable recommendations. Since its integration with Google Lighthouse, it has become an even more powerful tool . It provides a “GTmetrix Grade” which is a weighted average of two key scores:
- Performance Score (from Lighthouse): This score (0-100%) measures how quickly users perceive your page as being loaded. It’s based on metrics like LCP, TBT, and Speed Index.
- Structure Score: This is a proprietary GTmetrix score that assesses how well your site is built for performance, checking for best practices like using a CDN, optimizing images, and minifying code. Improving your Structure Score generally leads to a better Performance Score .
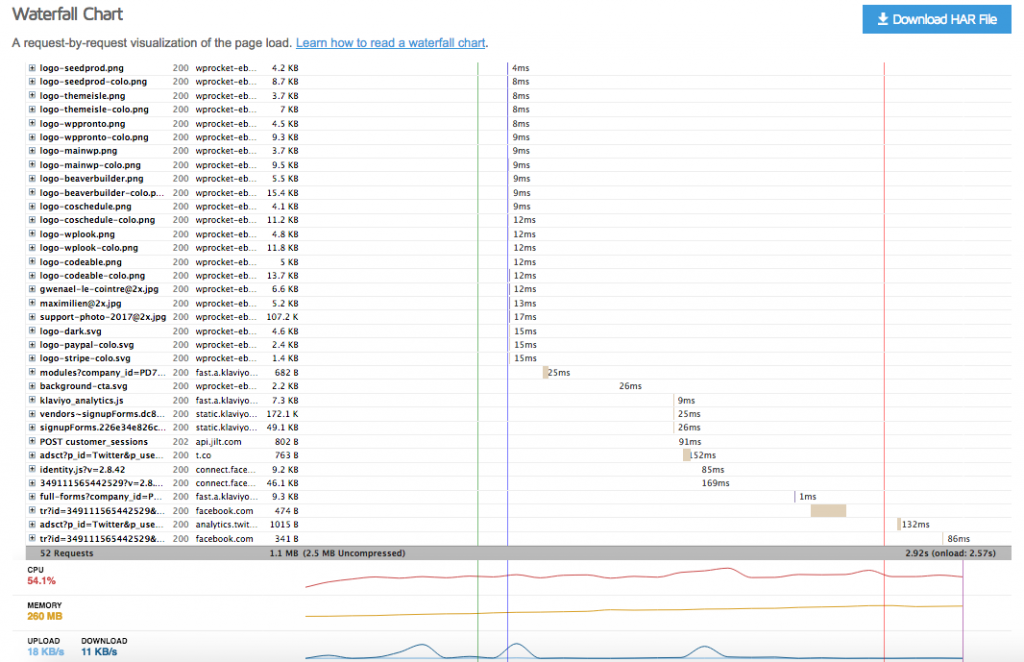
Its most powerful feature is the Waterfall Chart, which provides a request-by-request visualization of your page load. This is indispensable for pinpointing exactly what is slowing down your site, from large images to slow third-party scripts.
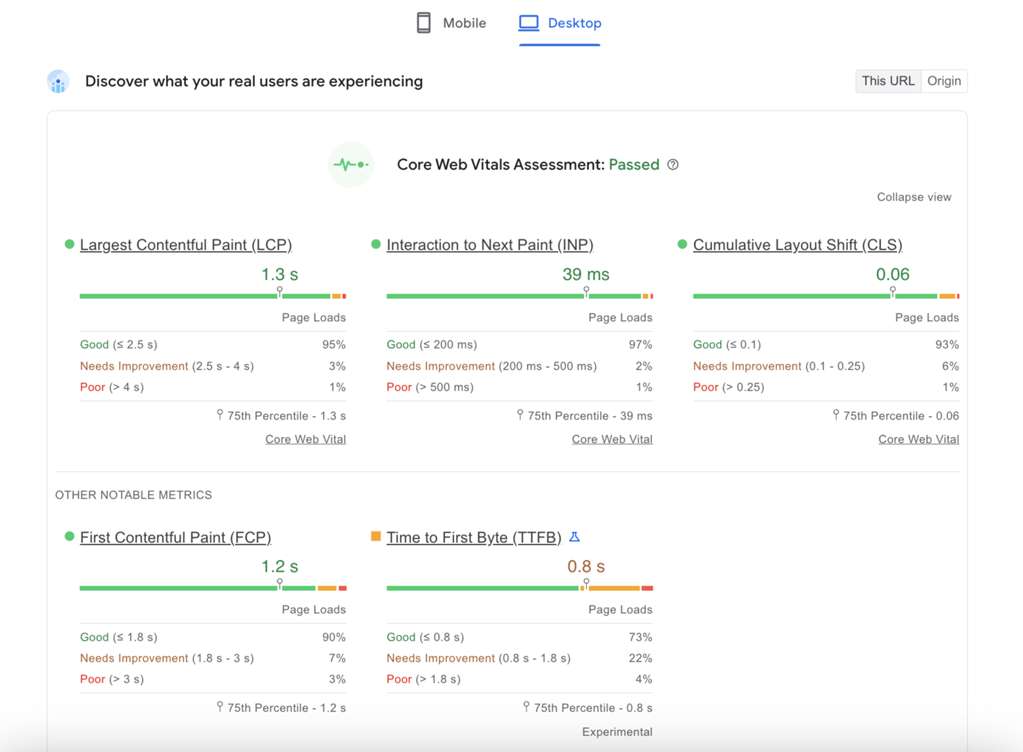
Google PageSpeed Insights (PSI): The Official Benchmark
PageSpeed Insights is Google’s own free tool for performance analysis. Its primary value lies in its direct use of both lab and field data. When you analyze a URL, PSI provides two distinct sections:
- “;Discover what your real users are experiencing”: This section shows your site’;s Core Web Vitals assessment based on CrUX field data from the last 28 days. If your site has enough traffic, this will show a “Passed” or “Failed” status. This is the data that directly influences your rankings.
- “Diagnose performance issues”: This section provides lab data from a single Lighthouse run. It gives you a performance score (0-100) and a list of actionable “Opportunities” and “Diagnostics” to improve your page speed.
While essential, PSI has limitations. It tests from a single, undisclosed location and network condition, which may not reflect your target audience’s experience. Therefore, it’s best used as Google’s official report card, complemented by tools like GTmetrix for more flexible and detailed debugging .
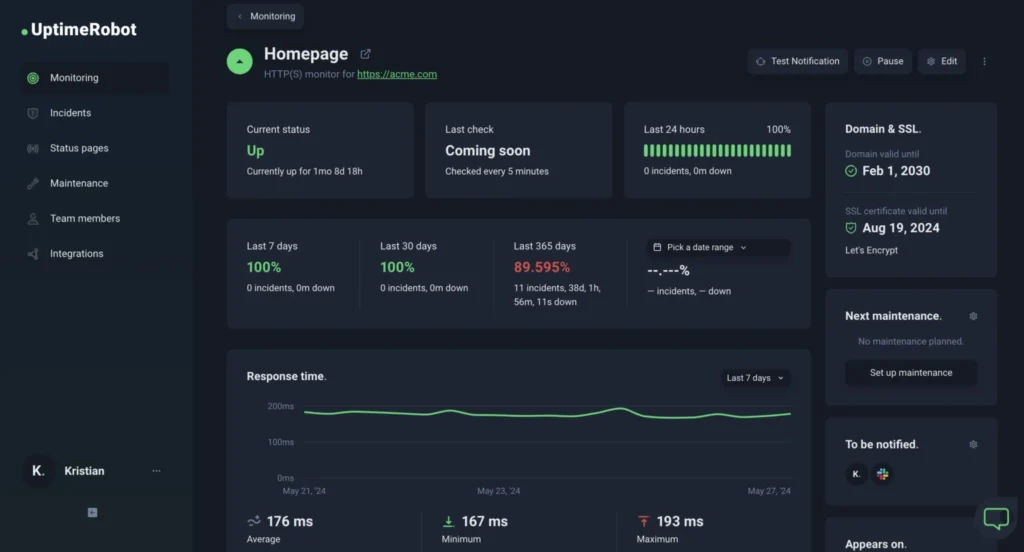
UptimeRobot: The Gold Standard for Uptime Monitoring
UptimeRobot is a simple, reliable, and incredibly popular service dedicated to one thing: telling you when your site is down. Its generous free plan makes it a no-brainer for any WordPress site owner .
- Check Types: It supports various checks, including HTTP(S) to see if your site returns a 200 OK status, Keyword checks to ensure specific text is present on a page, and Port checks for services like email or FTP.
- Alerts: When a downtime is detected (confirmed from multiple locations to prevent false positives), it sends instant alerts via email, Slack, SMS, Microsoft Teams, and more.
- Free Tier: The free plan includes 50 monitors with 5-minute checking intervals, which is more than sufficient for most small to medium-sized websites.
Pingdom: The Enterprise-Grade Alternative
Pingdom offers similar uptime monitoring capabilities to UptimeRobot but is generally geared more towards enterprise clients. It provides more advanced features like Real User Monitoring (RUM) to track the experience of actual visitors and Transaction Monitoring to simulate multi-step user journeys, such as logging in or completing a purchase. While more powerful, its pricing starts at a higher point, making UptimeRobot a better starting point for most .
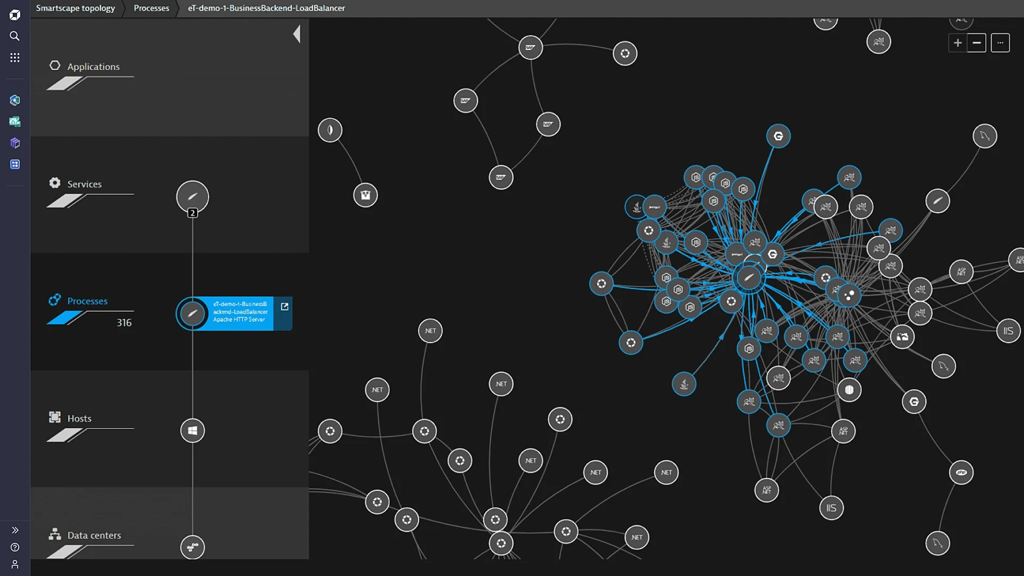
New Relic & Dynatrace: The APM Powerhouses
Application Performance Monitoring (APM) tools represent the next level of monitoring. They go beyond page load times to give you code-level visibility into your WordPress application’;s performance. For complex or high-traffic sites, they are essential.
- What they do: An APM agent is installed on your server. It traces every request, showing you how much time is spent in PHP execution, which database queries are the slowest, and which external API calls are creating bottlenecks.
- Why it’s powerful for WordPress: An APM tool can tell you definitively: “The `slow_plugin_function` in the `example-plugin` is responsible for 80% of your page load time because it’s running 50 inefficient database queries on every page view.” This level of insight is impossible to get from front-end tools alone.
While services like New Relic and Dynatrace have steeper learning curves and higher costs, they are the ultimate tools for debugging persistent, complex performance issues on mission-critical WordPress sites WP Engine, .
Implementation Guide: Setting Up Automated Monitoring
Setting Up Scheduled Performance Tests with GTmetrix
- Create a free GTmetrix account: Go to GTmetrix.com and sign up. A free account is required for scheduling tests.
- Analyze Your Homepage: Enter your site’s URL and run your first test to establish a baseline.
- Schedule Monitoring: On the report page, find the “Monitor” button. You can set up daily, weekly, or monthly checks. For a business site, daily is recommended. Select the test location closest to your primary audience.
- Set Up Alerts: In the monitoring settings, you can configure alerts. This is a powerful feature. For example, you can set an alert to be notified via email if your GTmetrix Grade drops below ‘B’, your LCP exceeds 2.5 seconds, or your Fully Loaded Time goes above 3 seconds. This turns GTmetrix from a manual tool into a proactive watchdog.
Setting Up Uptime Monitoring with UptimeRobot
- Sign up for a free account: Visit UptimeRobot.com. The free plan is robust and sufficient for most users to start.
- Add a New Monitor: Click the “+ Add New Monitor” button.
- Configure the Monitor:
- Monitor Type: Select “HTTP(S)”.
- Friendly Name: Give it a recognizable name, like “My WordPress Site”.
- URL (or IP): Enter your full website URL (e.g., `https://www.example.com`).
- Monitoring Interval: The free plan allows for 5-minute intervals.
- Set Up Alert Contacts: On the right side, select the checkbox next to your email address to receive alerts. You can add more contacts or integrate with services like Slack in the “My Settings” area.
- Create a Status Page (Optional but Recommended): UptimeRobot allows you to create a public status page. This is a great way to be transparent with your users during an outage, showing them you are aware of the issue and are working on it.
Deep Dive: WordPress Monitoring Plugins
While external tools provide an essential outside-in view, WordPress monitoring plugins offer the unparalleled convenience of integrating performance and uptime data directly into your admin dashboard. They are the “inside-out” perspective, providing context and ease-of-use that external services can’t match.
Introduction to Plugin-Based Monitoring: Convenience vs. Overhead
The primary concern with any plugin is its potential impact on site performance. A poorly coded plugin can add database bloat, run inefficient queries, or load unnecessary scripts, ironically slowing down the site it’;s meant to monitor. However, modern, well-coded monitoring plugins are designed to be lightweight. They typically run their checks on a schedule using WP-Cron or communicate with an external API, minimizing their real-time impact on your site’s front-end performance . The key is to choose reputable plugins and avoid those that are bloated or outdated.
Plugin Categories & Top Picks for 2025
WordPress monitoring plugins generally fall into three categories. Here are the top choices for 2025 in each.
1. All-in-One Management & Monitoring Platforms
These are designed for users, especially agencies and freelancers, who manage multiple WordPress sites. They combine monitoring with maintenance tasks like updates, backups, and security scans into a single, unified dashboard.
- WP Umbrella: A leading choice in this category, WP Umbrella provides a comprehensive suite from a single dashboard. It excels at uptime monitoring, performance tracking (via Google PageSpeed scores), PHP error logging, and security checks. Its focus on a clean interface and essential features makes it highly efficient for managing a portfolio of sites .
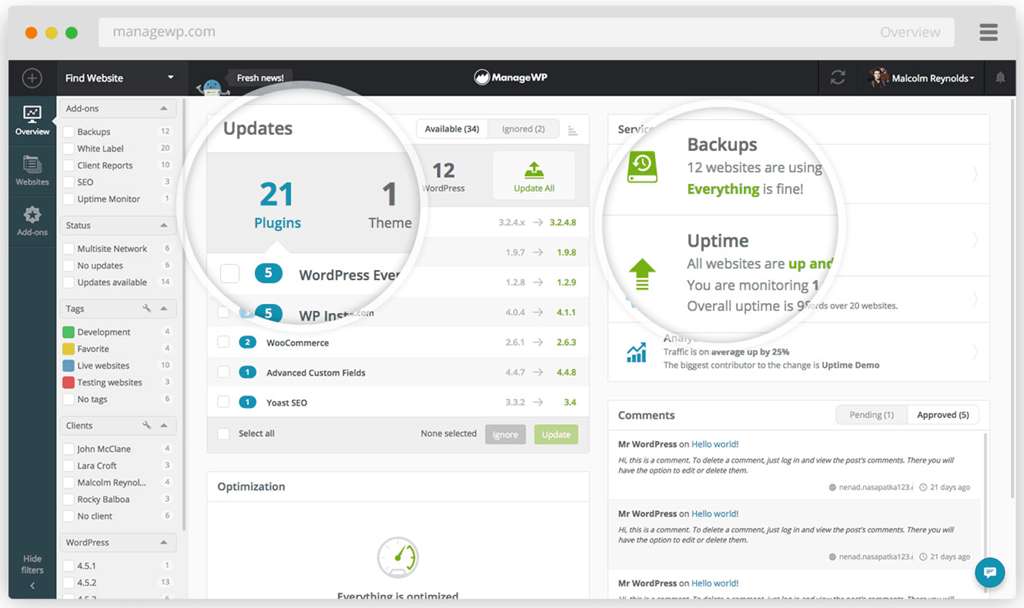
- ManageWP Worker: A long-standing and popular service, ManageWP offers a powerful central dashboard to manage updates, backups, and security. Its Uptime Monitor is a paid add-on but is highly effective, allowing for check intervals as low as one minute and providing instant alerts .
2. Dedicated Performance & Health Monitoring Plugins
These plugins focus specifically on tracking performance metrics or server health from within WordPress.
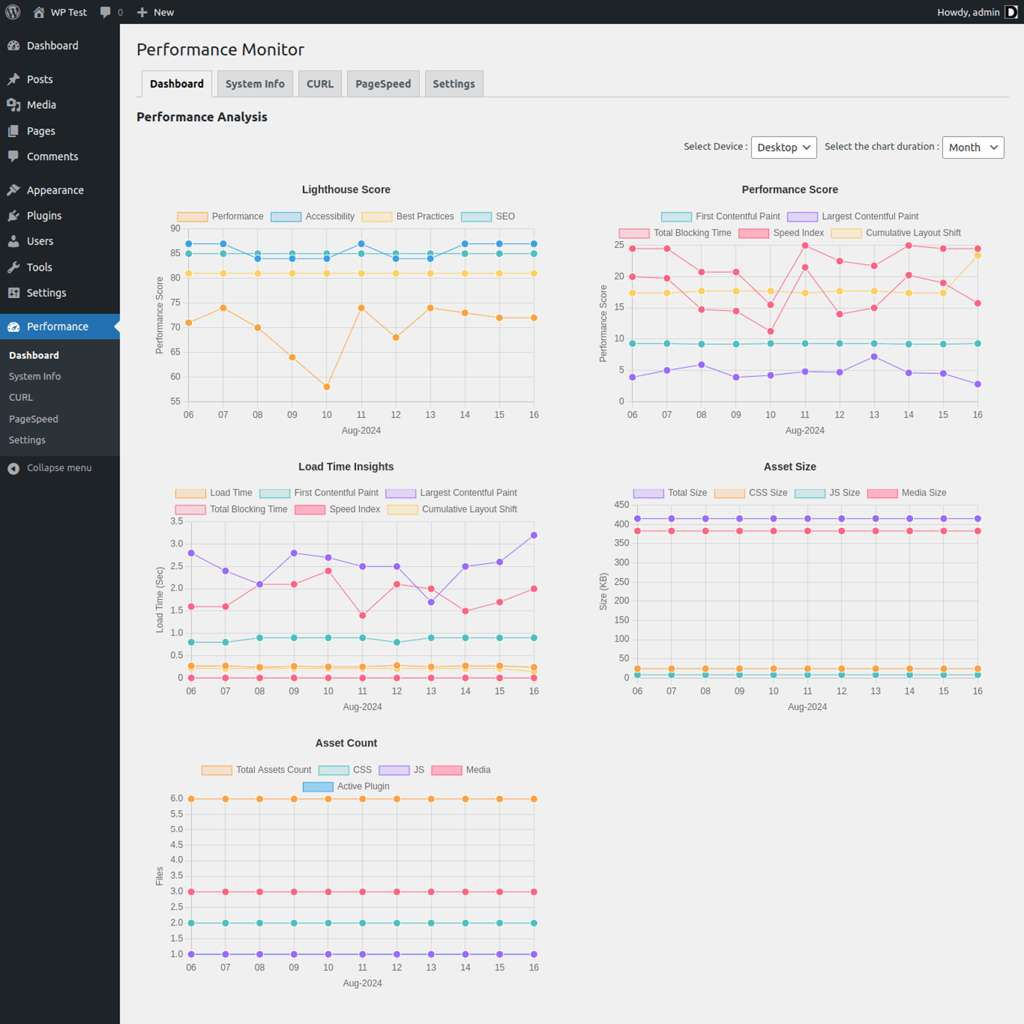
- Performance Monitor: A free and powerful plugin that leverages the Google PageSpeed API to run scheduled performance checks. Its key strength is storing historical data and presenting it in easy-to-read charts within your WP-Admin. This allows you to visually track your Lighthouse scores, Core Web Vitals, and asset sizes over time, making it easy to spot performance regressions after a site change .
- Query Monitor: This is an indispensable free debugging tool for developers. While not an “automated”; alerting tool, it’s the go-to plugin for manually diagnosing *why* a site is slow. It adds a debug menu to the admin bar that shows all database queries, PHP errors, hooks, enqueued scripts, and HTTP API calls for the current page load. It’s the best way to find a specific plugin or theme function that’s causing a bottleneck .
- WP Server Health Stats: This plugin provides a simple way to monitor your server’s core resources directly from the WordPress dashboard. It displays key stats like server uptime, memory usage, and CPU load, helping you determine if a performance issue is related to your WordPress application or the underlying server hardware .

3. Uptime Monitoring within Multi-Purpose Plugins
Some large, multi-functional plugins include uptime monitoring as one of their many features.
- Jetpack: Developed by Automattic (the company behind WordPress.com), Jetpack is a suite of tools for security, performance, and marketing. Its “Downtime Monitoring” module is available for free. Once enabled, it checks your site from Automattic’s global servers and sends you an email notification if your site becomes unresponsive. It’s a simple, reliable, “set-it-and-forget-it” option if you’re already using Jetpack for its other features .
Comparison Table: Top WordPress Monitoring Plugins (2025)
| Plugin | Primary Focus | Key Features | Performance Impact | Pricing (2025) | Best For |
|---|---|---|---|---|---|
| WP Umbrella | All-in-One Management | Uptime, Perf. Scores, PHP Errors, Backups, Security | Low | Premium (Starts ~$1.99/mo/site) | Agencies, Freelancers |
| Performance Monitor | Historical Perf. Tracking | PageSpeed API integration, historical charts, scheduled checks | Low | Free | Site owners wanting to track trends |
| Jetpack | Multi-purpose Suite | Downtime Monitoring (free module), Security, Backups | Medium (if all modules active) | Free for monitoring | Users already invested in Jetpack |
| Query Monitor | Developer Debugging | DB Queries, PHP Errors, Hooks, Scripts | High (only when active during debugging) | Free | Developers troubleshooting specific issues |
| SiteAlert | Health & Security Checks | Uptime, Speed, Security, Blacklist monitoring | Low | Freemium (Uptime is Premium) | Users wanting basic automated health checks |
Implementation Guide: Setting Up Historical Performance Tracking with the “Performance Monitor” Plugin
- Install and Activate: From your WordPress dashboard, navigate to `Plugins > Add New`. Search for “Performance Monitor” and install/activate the plugin developed by Qrolic.
- Get a Google PageSpeed API Key: The plugin requires a free API key to fetch data from Google. Follow a guide like the one from WP Adminify to create your key in the Google Cloud Console.
- Configure the Plugin: Navigate to the new `Performance > Settings` menu in your dashboard. Paste your API key into the designated field.
- Set the Schedule: In the same settings tab, configure the “Performance Monitor Frequency.” For most sites, a “Daily” check is a good starting point. This will automatically run a PageSpeed test every day and save the results.
- Analyze Your Data: After a few days, go to the `Performance > Dashboard` tab. You will now see charts populated with your site’s performance data over time. You can switch between Desktop and Mobile views and analyze trends in your Lighthouse scores, Core Web Vitals, and asset counts. This visual history is invaluable for correlating performance changes with site updates.
Deep Dive: Advanced & DIY Monitoring
For those with the technical expertise and a desire for ultimate control, building a custom monitoring solution or deploying open-source server tools offers a powerful alternative to SaaS products and WordPress plugins. This approach is not for everyone, but it provides unparalleled flexibility and can be extremely cost-effective.
When to Go DIY
Opting for a Do-It-Yourself monitoring solution makes sense in several scenarios:
- Unique Requirements: You need to check a specific, non-standard condition that off-the-shelf tools don’t support.
- Budget Constraints: You manage dozens or hundreds of sites and the cumulative cost of SaaS subscriptions is prohibitive.
- Total Control & Data Privacy: You want to avoid third-party dependencies and keep all monitoring data within your own infrastructure.
- Integration Needs: You need to integrate monitoring alerts into a custom internal system or workflow.
The main trade-off is the investment of time and expertise. You become responsible for the setup, maintenance, and reliability of the monitoring system itself .
Method 1: Custom Bash Scripts with Cron Jobs
The simplest form of DIY monitoring is a shell script running on a server. The concept is straightforward: a script runs at a scheduled interval, performs a check on your WordPress site, and takes an action if the check fails.
A common approach is to use `cURL`, a command-line tool for transferring data with URLs, to check the HTTP status code of your website. A status code of `200 OK` means the site is up, while anything else (like `500 Internal Server Error` or a timeout) indicates a problem.
Here is a well-commented sample Bash script for basic uptime monitoring, based on examples found across the developer community Seismic Pixels, :
#!/bin/bash

# === CONFIGURATION ===
# URL of the WordPress site to check
URL_TO_CHECK="https://your-wordpress-site.com"
# Email address to send alerts to
ADMIN_EMAIL="your-email@example.com"
# File to store the last status to prevent spamming alerts
STATUS_FILE="/tmp/website_status.log"

# === SCRIPT LOGIC ===
# Get the HTTP response code from the website
# -s: silent mode
# -o /dev/null: discard the body output
# -w "%{http_code}": write out only the HTTP code
# --connect-timeout 10: max 10 seconds to connect
# --max-time 15: max 15 seconds for the whole operation
RESPONSE_CODE=$(curl --connect-timeout 10 --max-time 15 -s -o /dev/null -w "%{http_code}" "$URL_TO_CHECK")

# Get the last known status from the status file
LAST_STATUS=$(cat "$STATUS_FILE" 2>/dev/null)

if [ "$RESPONSE_CODE" -eq 200 ]; then
    # Site is UP
    if [ "$LAST_STATUS" != "UP" ]; then
        # If the site was previously down, send a recovery notification
        echo "RECOVERY: $URL_TO_CHECK is back online at $(date)" | mail -s "Recovery Alert: $URL_TO_CHECK is UP" "$ADMIN_EMAIL"
        echo "UP" > "$STATUS_FILE"
    fi
else
    # Site is DOWN
    if [ "$LAST_STATUS" != "DOWN" ]; then
        # If the site was previously up, send a down notification
        echo "ALERT: $URL_TO_CHECK is down! Responded with status code: $RESPONSE_CODE at $(date)" | mail -s "Website Down Alert: $URL_TO_CHECK" "$ADMIN_EMAIL"
        echo "DOWN" > "$STATUS_FILE"
    fi
fi
To automate this script, you would set it up as a cron job to run at regular intervals. For example, to run it every 5 minutes, you would edit your crontab (`crontab -e`) and add the following line:
*/5 * * * * /path/to/your/monitor_script.sh >/dev/null 2>&1Method 2: Dedicated Server Monitoring Tools
For a truly comprehensive DIY solution, you can deploy open-source infrastructure monitoring tools. These are enterprise-grade platforms that monitor the health of the entire server, not just the WordPress application running on it.
- Zabbix &; Nagios: These are two of the most popular open-source monitoring systems . They can monitor thousands of metrics from servers, network devices, and applications. You can configure them to track CPU usage, memory consumption, disk space, network latency, and the status of services like Apache, Nginx, and MySQL.
- When to use them: This approach is ideal when you suspect performance problems are rooted in the server infrastructure itself. If your site is slow due to high CPU load or insufficient RAM, a front-end tool will only report a high TTFB. A tool like Zabbix will show you the CPU spike, identify the responsible process, and allow you to diagnose the root cause.
Setting up Zabbix or Nagios is a complex task requiring dedicated server resources and significant system administration knowledge. However, for agencies or businesses managing their own servers, they provide a level of insight and control that is second to none.
From Data to Action: Troubleshooting with Monitoring Tools
Setting up automated monitoring is only half the battle. The true value lies in your ability to interpret the data, diagnose problems, and take concrete actions to improve your WordPress site’s performance. This section provides a practical workflow for turning monitoring alerts into optimization wins.
The Troubleshooting Workflow
A systematic approach is key to efficient troubleshooting. When an alert comes in, resist the urge to make random changes. Instead, follow a logical process:
- The Alert: You receive a notification. It could be an “Uptime: Down” alert from UptimeRobot or a “Performance: LCP increased to 4.1s” alert from GTmetrix.
- Initial Diagnosis (The “What”;): Use a high-level tool like GTmetrix or PageSpeed Insights to get a quick overview. What metric is failing? Look at the “Top Issues” or “Opportunities” section. Did the total page size or number of requests suddenly increase? This initial scan helps you form a hypothesis.
- Deep Dive Analysis (The “Why”): Based on your hypothesis, use a specialized tool to dig deeper.
- If you suspect a front-end issue (large images, render-blocking scripts), the GTmetrix Waterfall Chart is your best friend.
- If you suspect a back-end issue (high TTFB, slow server response), a tool like Query Monitor or an APM like New Relic is necessary to inspect server-side processes.
- Implement & Verify: Apply a specific fix based on your analysis. Then, re-run your tests to verify that the change had the intended positive effect and didn’t introduce new problems.
Reading a GTmetrix Waterfall Chart
The Waterfall Chart is arguably the most powerful feature of GTmetrix for diagnosing front-end performance issues. It shows every single file (HTML, CSS, JS, images, fonts) that your browser has to download to render your page, and how long each step takes .
Here’s how to spot common problems:
- Long Initial Bar (High TTFB): The very first request is for your HTML document. If its bar has a long, dark green “Waiting (TTFB)” portion, it means your server took a long time to generate the page. This points to a back-end or hosting issue, not a front-end one.
- Large, Long Bars for Images: Look for image files (e.g., `.jpg`, `.png`) with large file sizes and long download times. These are prime candidates for compression, resizing, or conversion to a modern format like WebP.
- Render-Blocking Resources: Look for CSS and JavaScript files early in the waterfall that are blocking subsequent downloads. These are “render-blocking resources” that GTmetrix will flag.
- Slow Third-Party Scripts: Identify requests to external domains (e.g., `connect.facebook.net`, `analytics.google.com`, `fonts.googleapis.com`). If these have long connection or download times, they are slowing down your site. You might need to defer them or host them locally.
Pinpointing Plugin/Theme Issues with APM and Query Monitor
When your TTFB is high, the problem lies on your server. For WordPress, this often means an inefficient plugin, theme, or database query. This is where front-end tools fall short and back-end tools shine.
- Using Query Monitor: After installing and activating Query Monitor, load a slow page on your site. The admin bar at the top will display key metrics. Click on it to open the full panel. Navigate to the “Queries” ->; “Queries by Component” tab. This will show you a list of all your plugins and your theme, along with how many database queries each one made and how long they took. A plugin making hundreds of queries or one with a single very slow query is an immediate red flag .
- Using New Relic (APM): If you have New Relic installed, the process is even more direct. In your New Relic dashboard, you can navigate to a “;WordPress” section that often includes a “Plugins and themes” tab. This tab provides a ranked list of the plugins consuming the most execution time, making it incredibly easy to spot the worst offenders .
Addressing Common Alerts
- Alert: “High TTFB” / “Reduce initial server response time”
- Action: This is a server-side issue.
- Check your hosting plan. If you’re on cheap shared hosting, this is a common problem. Consider upgrading.
- Enable page caching. Use a plugin like WP Rocket or check if your host provides server-level caching.
- Use Query Monitor to look for slow database queries or plugins with high execution time.
- Action: This is a server-side issue.
- Alert: “Eliminate Render-Blocking Resources”
- Action: This means JavaScript or CSS is blocking the page from rendering.
- Use a performance optimization plugin like WP Rocket or Perfmatters. They have features to “Load JavaScript Deferred” and “Optimize CSS Delivery” (e.g., by removing unused CSS or loading it asynchronously).
- Action: This means JavaScript or CSS is blocking the page from rendering.
- Alert: “LCP element is slow to load”
- Action: The largest element on the page is taking too long to appear.
- Identify the LCP element in your GTmetrix or PSI report. It’s usually a large hero image or a block of text.
- If it’s an image, ensure it’s properly sized, compressed, and served in a modern format like WebP.
- Consider preloading the LCP image. Performance plugins often have an option for this, or you can add the `rel=”preload”` link tag manually.
- Action: The largest element on the page is taking too long to appear.
A Decision Framework for WordPress Owners
Finding Your Perfect Monitoring Stack
There is no single “best”; monitoring tool; there is only the best tool *for you*. The right choice depends on your website’s complexity, your technical expertise, your budget, and the number of sites you manage. This framework will help you select the most appropriate monitoring stack for your specific needs.
Start Here: What is your primary role?
Scenario 1: The Solopreneur / Blogger
- Needs: Basic, reliable uptime alerts so you know if your site is down. Simple, free tools to track general performance trends and identify obvious issues. The primary goal is to avoid major outages and gradual performance decay without a significant time or cost investment.
- Recommended Stack:
- Uptime Monitoring: UptimeRobot (Free Plan). Set up one HTTP(S) monitor with 5-minute checks and email alerts. It’s free, reliable, and takes minutes to configure.
- Performance Tracking: Performance Monitor Plugin (Free). Install this to get automated, historical performance charts inside your WordPress dashboard. It helps you see if your site is getting slower over time.
- Manual Checks: Use Google PageSpeed Insights once a month or after major changes (like installing a new plugin) to check your Core Web Vitals score.
- Budget: $0 / month.
Scenario 2: The Small Business / eCommerce Store
- Needs: High reliability is paramount because downtime equals lost revenue. You need more frequent checks, performance trend analysis, and immediate, multi-channel alerts. The ability to quickly diagnose whether a problem is front-end or back-end is crucial.
- Recommended Stack:
- Uptime Monitoring: UptimeRobot (Pro Plan). Upgrade for 1-minute checks, SMS alerts, and SSL certificate monitoring. Cost: ~$7/month.
- Performance Optimization & Monitoring:
- Option A (Integrated): A comprehensive solution like WP Umbrella. It combines uptime, performance, and error monitoring in one dashboard, simplifying management. Cost: Starts around $2/month per site.
- Option B (Component-based):
- GTmetrix (Pro Plan): Use this for scheduled daily monitoring with alerts for performance degradation. This gives you detailed reports and waterfall charts. Cost: Starts around $10/month.
- WP Rocket: While primarily an optimization plugin, its database cleanup and heartbeat control features are a form of proactive health maintenance. Cost: ~$59/year.
- Budget: $15 – $60 / month.
Scenario 3: The Agency / Freelance Developer
- Needs: Efficiently manage and monitor a portfolio of client sites from a single dashboard. Require deep diagnostic tools to quickly troubleshoot complex issues. Need the ability to generate client reports and scale solutions cost-effectively.
- Recommended Stack:
- Management Dashboard: WP Umbrella or ManageWP. These are essential for a unified view of all client sites, showing uptime status, available updates, and performance snapshots at a glance.
- Deep Diagnostics: New Relic (APM). For critical or problematic client sites, having an APM tool is a game-changer. It allows you to go beyond “the site is slow” to “the site is slow because of this exact function in this plugin.” Many managed WordPress hosts like WP Engine offer New Relic as an add-on .
- Automated Testing & Reporting: GTmetrix API. Integrate the API into your internal workflows or use tools like Zapier to automate performance tests after deployments and pipe the results into a central report or Slack channel.
- Essential Debugging Tool: Query Monitor should be in every developer’s toolkit for local and staging environment debugging.
- Budget: Scales per site. Starts with dashboard fees (e.g., ManageWP’s uptime is $1/site/mo) and can increase significantly with APM licensing for multiple sites.
The Future of WordPress Monitoring: AI and Integrated Observability
The landscape of website monitoring is undergoing a significant transformation, moving from simple, threshold-based alerts to intelligent, predictive, and holistic systems. As we look beyond 2025, two major trends are set to redefine how we monitor WordPress performance: AI-driven analysis and the shift towards integrated observability.
AI-Powered Anomaly Detection
Traditional monitoring relies on static thresholds: “Alert me if LCP is over 2.5 seconds.” The future is AI-powered anomaly detection, where systems learn your site’s normal performance patterns and alert you to deviations, even if they don’t cross a predefined threshold. AI tools can analyze vast datasets in real-time to identify subtle correlations that a human might miss .
For example, an AI-powered system might generate an alert like: “Your average server response time has increased by 15% in the last 3 hours, which is anomalous for a Tuesday afternoon. This correlates with a spike in database queries from the `new-feature` plugin.” This moves beyond simple alerting to providing initial diagnostic insights.
Automated Root Cause Analysis
The next evolution is automated root cause analysis. Instead of just presenting data and leaving the interpretation to the developer, future tools will use AI to suggest the most probable cause of a performance issue. Platforms are already emerging that can correlate a performance drop with a recent code deployment, a specific plugin update, or a change in user traffic patterns. This dramatically reduces Mean Time to Resolution (MTTR) by pointing developers directly at the source of the problem .
Full-Stack Observability: The End of Siloed Tools
The most significant trend is the convergence of monitoring tools into unified “observability” platforms. For years, teams have used separate tools for uptime (UptimeRobot), front-end performance (GTmetrix), back-end performance (New Relic), and server logs. This creates data silos and makes it difficult to see the full picture.
Observability platforms like Datadog, New Relic, and Dynatrace are breaking down these silos by combining three key data types:
- Metrics: Time-series numerical data (e.g., CPU usage, page load time, conversion rate).
- Logs: Timestamped records of events (e.g., PHP error logs, server access logs).
- Traces: A record of the entire journey of a single request as it travels through the different parts of your application stack.
By integrating these data sources, a developer can seamlessly pivot from a performance metric spike (the “what”) to the associated error logs and request traces (the “why”) within a single interface. For WordPress, this means a future where you can see a drop in your LCP score and immediately drill down to the specific PHP error and database query that caused it, all in one place .
(Separate Tools for Uptime, Performance, Logs) → Integrated Observability
(One Platform for Metrics, Logs, Traces)
Conclusion: Turn Monitoring into Your Competitive Advantage
In the hyper-competitive digital landscape of 2025, leaving your WordPress site’;s performance and uptime to chance is no longer an option. As we’ve explored, the health of your website is inextricably linked to your SEO rankings, user experience, brand reputation, and ultimately, your bottom line. The manual, reactive approach of waiting for users to report problems is a relic of the past. Proactive, automated monitoring is now a non-negotiable component of any serious online strategy.
Key Takeaways from This Guide
- Monitoring is a Strategy, Not a Chore: Automated monitoring directly impacts your business goals by protecting your Core Web Vitals, improving user experience, and enabling proactive problem-solving.
- There’s a Tool for Every Need: The “best” monitoring stack is the one that fits your specific context. Whether you’re a solo blogger, a growing eCommerce store, or a large agency, a tailored solution exists that balances cost, features, and technical requirements.
- Start Simple, Scale Smartly: You don’t need an enterprise-grade APM solution from day one. Begin with a simple, free stack to cover the basics of uptime and performance, and scale your investment as your site’s complexity and traffic grow.
- Data is Useless Without Action: The goal of monitoring is not just to collect data, but to use it. Learn to interpret reports, diagnose bottlenecks using tools like Waterfall Charts and Query Monitor, and systematically address the issues that have the biggest impact.
By implementing a robust and automated monitoring strategy, you shift from fixing problems to preventing them. You ensure a superior, reliable experience for your visitors, safeguard your hard-won SEO rankings, and build a foundation of trust and professionalism for your brand. This proactive stance is what separates thriving digital businesses from those that are constantly playing catch-up.
Don’t wait for your visitors to become your monitoring system. The tools and knowledge are at your fingertips. Take the first, crucial step today.
Start today by setting up a free UptimeRobot monitor and running a GTmetrix report. Take control of your site’s performance and turn what was once a technical headache into your most powerful competitive advantage. Leave your competitors in the digital dust.
Frequently Asked Questions (FAQ)
How do I monitor my WordPress site’s uptime for free?
The easiest way to monitor your WordPress site’;s uptime for free is by using an external service like UptimeRobot. Their free plan allows you to check up to 50 URLs every 5 minutes and sends email alerts when your site goes down. Alternatively, you can use the free downtime monitoring module within the Jetpack plugin.
What is the difference between GTmetrix and Google PageSpeed Insights for WordPress?
GTmetrix excels at providing detailed, lab-based performance analysis from various global locations, including an in-depth Waterfall Chart to diagnose specific loading issues. Google PageSpeed Insights (PSI) is Google’s own tool, which combines lab data from Lighthouse with real-world user data (Field Data) from the Chrome User Experience Report (CrUX). PSI is crucial for understanding your Core Web Vitals score as Google sees it, while GTmetrix is often better for granular troubleshooting.
Can WordPress monitoring plugins slow down my site?
Yes, any plugin can potentially add overhead. However, well-coded, modern monitoring plugins like WP Umbrella or Performance Monitor are designed to be lightweight. The most resource-intensive plugins are typically developer tools like Query Monitor, which should only be active during troubleshooting, not left running on a live site.
How can I automatically check my WordPress site speed?
You can automate site speed checks using a service like GTmetrix, which allows you to schedule daily or weekly tests and set up alerts for performance drops. Alternatively, you can use a WordPress plugin like ‘Performance Monitor’ which integrates with the Google PageSpeed API to run scheduled checks and store historical performance data directly in your WordPress dashboard.
What are Core Web Vitals and how do I monitor them on WordPress?
Core Web Vitals are a set of three specific metrics Google uses to measure user experience: Largest Contentful Paint (LCP), Interaction to Next Paint (INP), and Cumulative Layout Shift (CLS). You can monitor them using Google PageSpeed Insights, Google Search Console (Core Web Vitals report), or by setting up scheduled tests in tools like GTmetrix, which prominently display these metrics in their reports.
How do I find out which plugin is slowing down my WordPress site?
The most effective way is to use an Application Performance Monitoring (APM) tool like New Relic, which can pinpoint slow transactions directly to a specific plugin. For a free method, you can use the ‘;Query Monitor’ plugin. Activate it and check the ‘Queries by Component’ tab to see which plugins are making the most or slowest database queries. A less precise method is to deactivate plugins one by one on a staging site and run a speed test after each deactivation to see which one causes a significant performance improvement.
What is APM (Application Performance Monitoring) and do I need it for WordPress?
APM tools like New Relic or Dynatrace go beyond surface-level speed tests. They monitor the performance of the underlying code and database of your WordPress site. You generally need APM if you run a complex, high-traffic, or mission-critical website (like a large eCommerce or membership site) where identifying backend bottlenecks quickly is essential for stability and revenue.
Is it better to use an external service or a plugin to monitor my WordPress site?
It depends on your needs. External services (like UptimeRobot) are generally more reliable for uptime monitoring because they work even if your entire server is down. They also don’t add any load to your site. Plugins offer the convenience of an integrated dashboard within WordPress and can sometimes provide more context-specific data. A combination is often best: an external service for uptime and a plugin for performance trend analysis.

With over 27 years of hands-on SEO expertise, starting from my early days as a CFO. Quitting that job to build a top-ranked web hosting business in 1995, I’ve mastered WordPress optimization as a precise engineering discipline. Through extensive research, high-level consulting, and developing a WordPress site that achieved over a thousand organic Google rankings—culminating in a six-figure sale—I’ve decoded Google’s algorithm over 27 years to develop wordpress engineering that transforms underperforming WordPress sites into authoritative powerhouses. Business owners frustrated by stagnant traffic, low visibility, and missed opportunities find relief as I help them deliver measurable ROI through higher rankings, increased leads, and sustainable growth. As owner of dominant city-based SEO platforms in major U.S. markets, I outperform industry gurus, empowering entrepreneurs, local businesses, agencies, and marketers via my WordPress Optimization services at wordpressoptimization.com to unlock their site’s full potential.