
Mastering Advanced WordPress Database Optimization: 2025 Guide to Indexing, Transients, and Query Tuning
TL;DR: Advanced Database Optimization for WordPress is key to improving site performance and long-term scalability. By fine-tuning queries, adding efficient indexing, managing post revisions and transients, and implementing persistent object caching with solutions like Redis, you can dramatically reduce server load and speed up response times. This guide shows how to identify bottlenecks, apply advanced techniques, and keep your WordPress database running at peak performance as your website grows.
Table of Contents
- Introduction: Beyond Basic Caching – The Final Frontier of WordPress Speed
- Part 1: Diagnosis First – Uncovering Your Database Bottlenecks
- Part 2: The Art of Query Tuning – From Sluggish to Speedy
- Part 3: Database Indexing – Your Shortcut to Fast Data Retrieval
- Part 4: Taming Transients & Mastering Object Caching with Redis
- Part 5: Choosing Your Optimization Path: A Practical Framework
- Conclusion: From Bloated to Blazing-Fast
- Frequently Asked Questions (FAQ)
What is Advanced Database Optimization for WordPress?
Every WordPress site has a tipping point — when plugins, transients, post revisions, and database‐queries start producing lag that even good page caching can’t hide. If you’ve ever watched your dashboard crawl, felt spikes in Time to First Byte, or seen your server strain under query load, you already know that beyond surface‐level fixes there’s a deeper level of optimization. In this guide, we dive into advanced database optimization — from query tuning and indexing to cleaning up transients and mastering persistent object caching — so that WordPress becomes fast, responsive, and scalable even under serious traffic.
Why Choosing the Best WordPress Hosting Providers Matters for Performance & Support
Picking the right hosting provider isn’t just about raw server specs—it plays a crucial role in how well your optimized database actually performs and how smoothly support can help you when things go wrong. Here are the key benefits of going with top‐tier WordPress hosting:
-
Optimized Database Infrastructure – High-quality hosts offer finely tuned MySQL/MariaDB (or sometimes other engines), better defaults (buffer sizes, query cache, etc.), and sometimes even features like built-in object caching (Redis or Memcached), which gives you a head start before you optimize manually.
-
Faster Hardware & Network Stack – Strong SSD storage, good I/O performance, modern CPUs, and low-latency network pairs mean your queries, indexing, and data retrieval happen much faster; even well-optimized queries suffer on poor hardware or overloaded servers.
-
Specialized Support & Monitoring – When problems arise — slow queries, index creation, or database corruption — having support teams with WordPress and database experience means faster diagnosis and fixing. Also, many top hosts include monitoring, backups, and automated alerts, so you catch issues early.
-
Scalability & Resource Headroom – As your site grows (more posts, users, custom tables, plugins, etc.), your database will naturally expand and see more load. A high-quality host gives you the ability to scale up: more RAM, better disks, more CPU, often with managed options so you don’t have to re-architect everything manually.
-
Security, Backups, & Reliability – Your database is business critical. Good hosting providers ensure frequent backups, strong isolation (to avoid database table conflicts or noisy neighbors), secure latest versions of database software, and disaster recovery options. That means your optimizations are preserved and not undone by data loss or corruption.
Beyond Basic Caching – The Final Frontier of WordPress Speed
Your WordPress site has a powerful caching plugin, optimized images, and a top-tier Content Delivery Network (CDN), yet it still feels sluggish under load. Pages take a moment too long to generate, the backend feels unresponsive, and performance plummets during peak traffic. The culprit is often the most overlooked and misunderstood component of the WordPress ecosystem: the database.
Like the foundation of a skyscraper, the database—typically MySQL or MariaDB—underpins every action on your site. Every page load, user login, comment submission, and product search triggers a conversation with this digital archive. When the database is bloated, disorganized, and forced to run inefficient queries, it becomes a critical bottleneck, silently sabotaging your site’s speed, user experience, and ultimately, your Google rankings.
A slow database is a direct tax on performance. It inflates your Time to First Byte (TTFB)—a key metric in Google’s Core Web Vitals (CWV)—signaling to both users and search engines that your site is slow. The consequences are severe. Research from Google shows that a mere one-second delay in mobile page load times can slash conversion rates by up to 20% . In this context, advanced database optimization is not a technical luxury; it is a direct investment in revenue, user retention, and search visibility.
This guide moves beyond the one-click “cleanup” plugins that scratch the surface. It is an in-depth, world-class report on the three pillars of professional database performance engineering for WordPress, updated for 2025:
- Query Tuning: The art of finding and fixing inefficient database requests at their source, transforming slow, resource-hungry operations into lightning-fast interactions.
- Database Indexing: The science of creating intelligent data shortcuts, allowing your database to find information in milliseconds instead of performing slow, exhaustive table scans.
- Advanced Caching: The strategy of mastering WordPress Transients and implementing a persistent object cache with enterprise-grade tools like Redis to dramatically reduce database load.
We will begin by diagnosing the problem, providing you with the tools to uncover hidden bottlenecks. From there, we will dive into step-by-step optimization techniques, supported by real-world case studies and data. Finally, we will conclude with a practical framework to help you choose the right strategies for your specific site, transforming your database from a performance liability into a high-speed asset.
Part 1: Diagnosis First – Uncovering Your Database Bottlenecks
Effective optimization begins with accurate diagnosis. You cannot fix what you cannot measure. Before diving into complex optimizations, you must first identify the specific queries, tables, or configurations that are causing performance degradation. This section equips you with the essential tools and techniques to pinpoint the exact sources of database slowdowns, turning guesswork into a data-driven strategy.
Your Essential Toolkit
Two primary tools form the foundation of any serious WordPress database analysis: Query Monitor for real-time, on-page diagnostics, and MySQLTuner for a server-level health check.
Query Monitor: The Developer’s Best Friend
Query Monitor is a free, indispensable plugin from the WordPress repository that provides a detailed look into the inner workings of any page load. It’s a developer’s Swiss Army knife for performance, showing all database queries, PHP errors, hooks fired, HTTP API calls, and more. For our purposes, its “Queries” tab is pure gold.
Step-by-Step Usage:
- Install and activate the Query Monitor plugin from your WordPress dashboard.
- Once active, a new set of metrics will appear in your WordPress admin bar at the top of the screen. This bar is visible on both the front-end and back-end of your site (to logged-in administrators).
- Click on the metrics in the admin bar to open the main Query Monitor panel at the bottom of your screen.
- Navigate to the “Queries” tab.
How to Spot Problems in Query Monitor:
- Slow Queries: Query Monitor automatically highlights queries that take an unusually long time to execute (typically in red or orange). These are your primary targets. Note the “Time” column. Any query taking more than a few hundred milliseconds (0.1s – 0.2s) warrants investigation, and anything approaching a full second is a critical issue.
- Queries by Component: The “Queries by Component” filter is arguably the most powerful feature. It groups all queries by the plugin, theme, or WordPress Core file that initiated them. This allows you to immediately identify if a specific plugin is responsible for a large number of queries or a particularly slow one.
- Duplicate Queries: The “Duplicate Queries” view shows queries that are executed more than once with the exact same parameters on a single page load. This is a clear sign of inefficient code, often found in poorly written loops within themes or plugins. As noted by experts, it’s an invaluable tool for identifying these bottlenecks .
By spending just a few minutes browsing different pages of your site with Query Monitor active, you can build a clear picture of your database’s performance profile and identify the biggest offenders.
MySQLTuner: The Server-Level Health Check
While Query Monitor analyzes individual page requests, MySQLTuner provides a holistic view of your database server’;s health. It’s a read-only PERL script that you run via the command line on your server. It analyzes your MySQL/MariaDB configuration and status data (after it has been running for at least 24-48 hours to gather meaningful statistics) and provides specific, actionable recommendations to improve performance and stability.
MySQLTuner checks critical areas such as:
- Memory usage and allocation (e.g., buffer sizes).
- Query cache effectiveness.
- Join performance and temporary table usage.
- Index efficiency and suggestions for improvement.
- Table fragmentation.
After running, it produces a report with a “Recommendations” section at the bottom. This is where you’ll find valuable advice. Here is a sample of what its output might look like:
-------- Recommendations -------------------------------------------------
General recommendations:
    Run OPTIMIZE TABLE to defragment tables for better performance
    Enable the slow query log to troubleshoot bad queries
    Adjust your join_buffer_size to pending connections
    Your query cache is disabled. You should consider enabling it.
    query_cache_size must be bigger than 16M
Variables to adjust:
    join_buffer_size (> 256.0K, or use indexes with joins)
    query_cache_size (>= 16M)
    query_cache_limit (> 1M)
This tool is more advanced and requires SSH access to your server, but for those on VPS or dedicated servers, it’s an essential step in ensuring the underlying database server is configured optimally for your WordPress workload .
The Easiest First Win: Checking Autoloaded Data
Before you even begin tuning queries, there’s a simple check that can yield significant performance gains: auditing your autoloaded data. Inside the WordPress wp_options table, each row has a column named autoload. If this value is set to 'yes', WordPress loads that piece of data into memory on every single page load across your entire site, whether it’s needed or not.
While necessary for core settings like your site URL and active theme, many plugins and themes store large amounts of data here unnecessarily. This bloats memory usage and adds overhead to every request. As a best practice, your total autoloaded data size should be kept below 800 KB .
How to Check Your Autoloaded Data Size:
You can quickly check the size using a simple SQL query in a tool like phpMyAdmin:
SELECT SUM(LENGTH(option_value)) / 1024 AS "autoload_size_kb"
FROM wp_options
WHERE autoload = 'yes';
If the result is over 800 KB, it’s time to investigate. You can find the largest offenders with this query:
SELECT option_name, LENGTH(option_value) AS option_size
FROM wp_options
WHERE autoload = 'yes'
ORDER BY option_size DESC
LIMIT 20;
When you identify large options that are not essential for every page load (e.g., a plugin’s settings that are only used in the admin area), you can change their autoload value from 'yes' to 'no' directly within phpMyAdmin. This simple change prevents them from being loaded unnecessarily and can provide an immediate boost to your site’s backend performance.
Key Takeaways: Diagnosis
- Start with Measurement: Use Query Monitor to identify slow and duplicate queries on a per-page basis.
- Identify the Source: Use Query Monitor’s “Queries by Component” feature to pinpoint which plugins or themes are causing database strain.
- Check Server Health: For advanced users, run MySQLTuner to get server-level configuration recommendations.
- Score an Easy Win: Audit your autoloaded data in
wp_optionsand ensure the total size is under 800 KB.
Part 2: The Art of Query Tuning – From Sluggish to Speedy
Once you’ve diagnosed the “;what”; and “where” of your database bottlenecks, the next step is to fix the “how.” Query tuning is the process of rewriting or restructuring database queries to make them more efficient. This often involves providing the database with more specific instructions so it can retrieve data without performing unnecessary work. This section is geared towards developers or technically-inclined users who are comfortable editing code or running advanced database commands.
Analyzing Queries with EXPLAIN
The single most powerful tool for understanding query performance is the EXPLAIN command in MySQL/MariaDB. When you prefix a SELECT query with EXPLAIN, the database doesn’;t actually run the query. Instead, it returns its *execution plan*—a step-by-step breakdown of how it *intends* to retrieve the data. This plan reveals inefficiencies like full table scans and missed indexes.
Step-by-Step Analysis:
- Identify a Slow Query: Copy a slow query you found using Query Monitor.
- Access phpMyAdmin: Log in to your database management tool, select your WordPress database, and open the “SQL” tab.
- Run EXPLAIN: Paste the query and add the word
EXPLAINat the beginning. For example:
EXPLAIN SELECT * FROM wp_posts WHERE post_author = 5 AND post_status = 'publish'; - Analyze the Output: The command will return a table. Understanding this table is key to optimization.
How to Read the EXPLAIN Output:
Focus on these critical columns:
| Column | What it Means | What to Look For |
|---|---|---|
| type | The join type. This indicates how MySQL is accessing the table. | Bad: ALL. This is a full table scan, meaning MySQL is reading every single row to find matches. This is the primary cause of slow queries on large tables.Good: ref, eq_ref, const. These indicate that an index is being used effectively to find the data directly. |
| possible_keys | Shows which indexes MySQL *could* use to find the rows. | If this is NULL, it means no relevant indexes exist for the columns in your WHERE clause. This is a strong hint that you need to create one. |
| key | The actual index that MySQL decided to use. | If this is NULL but possible_keys is not, it means MySQL found an index but chose not to use it (perhaps because it estimated a full table scan would be faster on a small table). If both are NULL, you definitely have an indexing problem. |
| rows | An estimate of the number of rows MySQL must examine to execute the query. | A high number here, especially when combined with type: ALL, is a major red flag. The goal of optimization is to reduce this number as much as possible. |
| Extra | Contains additional information about the execution plan. | Bad Signs: Using filesort means MySQL has to do an extra pass to sort the results, which is slow. Using temporary means a temporary table had to be created in memory or on disk to process the query. Both indicate a need for optimization, often through better indexing. |
By using EXPLAIN, you can scientifically prove that a query is inefficient (e.g., it’s doing a full table scan) and then verify that your fix (e.g., adding an index) has worked by running EXPLAIN again and seeing the type change to ref and the rows count drop dramatically.
Best Practices for WP_Query Optimization
In WordPress, most front-end queries are generated by the WP_Query class. A poorly constructed set of WP_Query arguments in a theme or plugin is a common source of database strain. Fortunately, WP_Query provides several parameters specifically designed to reduce database load .
Here are some of the most impactful parameters you can use:
'fields' => 'ids': This is one of the most effective optimizations. If your loop only needs the ID of each post (e.g., to pass to another function), use this parameter. It tells WordPress to retrieve only theIDcolumn, which is much faster and uses less memory than fetching entire post objects.'no_found_rows' => true: By default,WP_Queryruns a second, expensive query (SQL_CALC_FOUND_ROWS) to determine the total number of posts that match the query, which is needed for pagination. If you are not using pagination for your query, setting this totrueskips that second query, effectively halving the database work.'update_post_term_cache' => false: If you are not going to use any taxonomy information (categories, tags) for the posts inside your loop, set this tofalse. This prevents WordPress from pre-fetching term data for all the posts in the result set.'update_post_meta_cache' => false: Similarly, if you are not going to use any post meta (custom fields) inside your loop, set this tofalseto prevent the pre-fetching of meta data.'cache_results'; => false: Use this with caution. It tells WordPress not to cache the results of this specific query in its internal object cache. This is only useful for queries that run infrequently and whose results you know should not be stored.
Example: Before and After Optimization
Imagine a simple query to get the titles of the 5 most recent posts.
The Inefficient Way:
// BAD: Fetches full post objects, calculates total rows, and caches meta/term data.
$args = array(
    'posts_per_page' => 5,
    'orderby'        => 'date',
    'order'          => 'DESC',
);
$recent_posts = new WP_Query( $args );
The Optimized Way:
// GOOD: Fetches only what's needed, skips pagination calculation and extra data fetching.
$args = array(
    'posts_per_page'         => 5,
    'orderby'                => 'date',
    'order'                  => 'DESC',
    'no_found_rows'          => true,  // We don't need pagination
    'update_post_term_cache' => false, // We don't need categories/tags
    'update_post_meta_cache' => false, // We don't need custom fields
);
$recent_posts = new WP_Query( $args );
While the difference may seem small for a simple query, applying these principles across a complex site with many custom loops can lead to substantial reductions in query count and execution time, directly improving your TTFB.
Part 3: Database Indexing – Your Shortcut to Fast Data Retrieval
If query tuning is the art of asking better questions, then database indexing is the science of organizing the library so that answers can be found instantly. For any WordPress site with a significant amount of content, users, or transactional data (like an e-commerce store), proper indexing is not optional—it is the single most effective technique for resolving slow SELECT queries.
What is an Index?
Think of a database table as a massive, unsorted book with thousands of pages. If you need to find every mention of a specific character, you have no choice but to read the entire book from cover to cover. This is a “full table scan,” and it’s incredibly slow.
A database index is like the index at the back of that book. It’s a separate, highly organized lookup table that lists key terms (the indexed column values) and the exact “page numbers” (row locations) where they can be found. When you query an indexed column, the database consults this small, efficient index first to find the exact locations of the data it needs, bypassing the need to scan the entire table .
The Indexing Trade-Off: It’s crucial to understand that indexes are not a free lunch. While they dramatically speed up read operations (
SELECT), they add a small amount of overhead to write operations (INSERT,UPDATE,DELETE). This is because every time you modify data in an indexed column, the index itself must also be updated. Therefore, indexing is most beneficial for columns that are frequently used inWHERE,JOIN, orORDER BYclauses of queries on tables that are read from far more often than they are written to.
Identifying Where to Add Indexes
The need for an index is most often revealed through the EXPLAIN analysis discussed in Part 2. If a query is slow and the EXPLAIN output shows type: ALL and a NULL value in the key column for a table, the column(s) in your WHERE clause are prime candidates for an index.
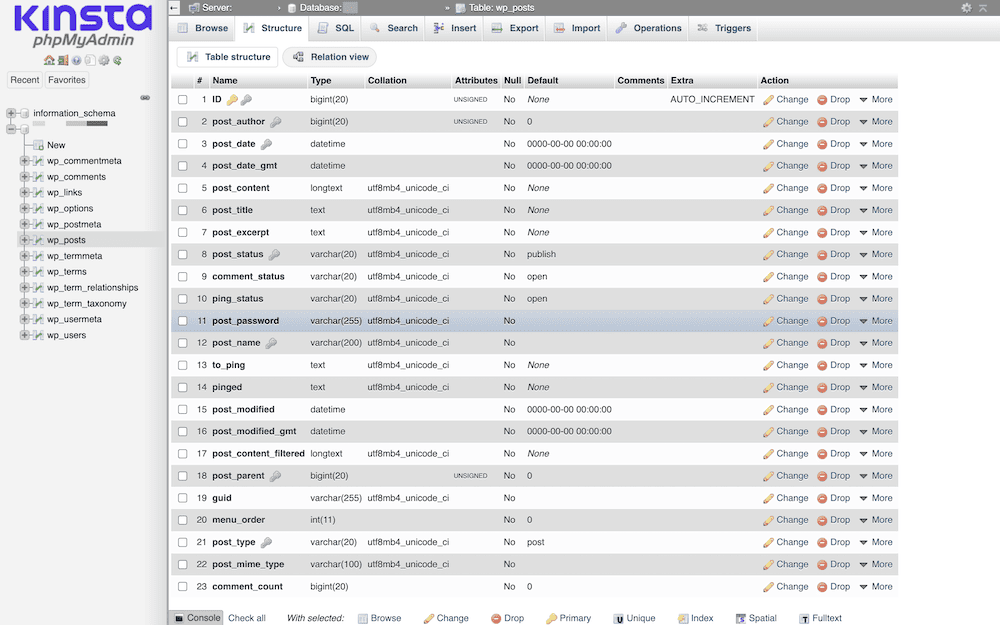
In the WordPress world, some tables are notoriously problematic due to their structure:
wp_postmetaandwp_usermeta: These tables use an Entity-Attribute-Value (EAV) model, which is flexible but often inefficient to query. On sites with many custom fields, such as those using Advanced Custom Fields (ACF) or WooCommerce, queries that filter by ameta_valueare common and can be extremely slow without a proper index on themeta_keyandmeta_valuecolumns. Optimizingwp_postmetaalone can provide more performance improvement than many premium plugins .wp_commentsandwp_commentmeta: On sites with high comment volume, queries to retrieve or filter comments can become slow.- Custom Tables from Plugins: Many plugins create their own custom tables. While WordPress Core tables are well-indexed by default, plugin developers sometimes neglect to add appropriate indexes to their custom tables, leading to performance issues as the tables grow.
Step-by-Step Guide: Adding an Index in phpMyAdmin
Adding an index is a powerful operation that modifies your database structure. Follow these steps carefully.
THE GOLDEN RULE: ALWAYS CREATE A FULL, VERIFIED BACKUP OF YOUR DATABASE BEFORE PROCEEDING.
- Log in to phpMyAdmin and select your WordPress database from the left-hand panel.
- Select the table you want to index (e.g.,
wp_postmeta). - Click on the “Structure” tab at the top.
- You will see a list of all the columns in the table. To add an index to a single column (e.g.,
meta_key), find that row and click the “Index” link in the “Action” column. - For a Composite Index: To create a more powerful index on multiple columns (e.g., for a query that filters by both
meta_keyANDmeta_value), scroll down below the column list to the “Indexes” section. Click “Add index”, specify the number of columns, and a new window will pop up. Here you can select the columns to include in the index (e.g.,meta_keyandmeta_value). For columns likemeta_value(which is alongtexttype), you may need to specify a prefix length (e.g., 191) because MySQL cannot index the entire length of very large text fields. - Confirm the action. MySQL will now build the index. This may take a few moments on a very large table.
After adding the index, run the EXPLAIN command on your slow query again. You should now see the database using your new index, with a dramatically lower number in the “rows” column.
Case Study: From 60 Seconds to 20 Milliseconds
The impact of proper indexing cannot be overstated. A compelling case study from WP-Bullet illustrates this perfectly. An online learning site with a gamification feature had a “leaderboard” page that was checked constantly by thousands of students. This page triggered an extremely slow query that often took over a minute to run, causing the entire site to slow down and frequently crash.
Diagnostic tools revealed the bottleneck: a heavy database query related to the leaderboard. The response times were catastrophic, often exceeding 100,000 milliseconds (1.6 minutes).
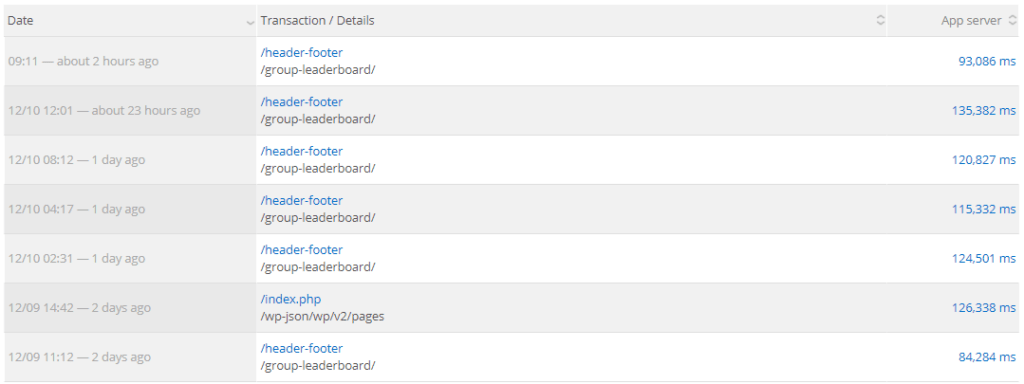
The root cause was a lack of appropriate indexes on the tables and columns used by the leaderboard query. The database was forced to perform massive table scans every time the page was loaded. The solution was not to add more server hardware, but to perform a targeted database optimization by adding the correct indexes.
The results were immediate and transformative. The query time plummeted from an average of 58,000 ms (58 seconds) to just 20 ms. The site’s overall average server response time was cut in half, and the crashes stopped completely.
This case study demonstrates that for database-intensive operations, a simple indexing fix can provide orders of magnitude more performance improvement than throwing more expensive hardware at the problem.
Part 4: Taming Transients & Mastering Object Caching with Redis
After tuning queries and building indexes, the final frontier of database optimization is to avoid hitting the database altogether. Caching is the strategy of storing the results of expensive operations (like database queries) in a faster, temporary location. This section covers two levels of this strategy: first, properly managing WordPress’s built-in caching mechanism, Transients, and second, implementing a high-performance, persistent object cache with Redis.
Section 4.1: Cleaning Up WordPress Transients
What are Transients?
The WordPress Transients API provides a simple way for developers to store temporary data in the database. It’s designed for caching the results of complex operations or remote API calls. For example, a weather widget plugin might fetch data from an external service and store it in a transient with a 1-hour expiration. For that hour, any request for the weather will get the data from the transient (a simple lookup in the wp_options table) instead of making another slow external API call .
The Problem: The Transient Bloat
In theory, transients are great. In practice, they have a critical flaw: WordPress’s native cleanup mechanism for expired transients is notoriously unreliable. The core delete_expired_transients function only runs on a cron job, and even then, it can be missed or fail. Furthermore, many plugins create transients without an expiration date, leaving them in the database forever. Over time, the wp_options table can become bloated with thousands of expired or orphaned transient entries. Since many of these are autoloaded, this directly slows down every single page load on your site .
How to Clean Transients (Safely)
Regularly cleaning out expired transients is essential database hygiene. Here are three methods, from safest to most aggressive:
- Plugin Method (Recommended for most users): Using a dedicated plugin is the safest and easiest way. Plugins like Transients Manager provide a user-friendly interface to view, search, edit, and delete transients. All-in-one optimization plugins like WP-Optimize and Advanced Database Cleaner also include robust transient cleaning features, often with scheduling capabilities.
- WP-CLI Method (For developers): If you have command-line access to your server, WP-CLI offers precise control.
- To safely delete only expired transients:
wp transient delete --expired - To aggressively delete all transients (they will be regenerated as needed, but may cause a temporary performance dip):
wp transient delete --all
- To safely delete only expired transients:
- SQL Method (Use with extreme caution): This is the most direct method but carries the highest risk. Only do this after making a full database backup. You can run these queries in phpMyAdmin to delete all transient entries:
DELETE FROM `wp_options` WHERE `option_name` LIKE ('_transient_%');
DELETE FROM `wp_options` WHERE `option_name` LIKE ('_site_transient_%');
By regularly cleaning transients, you prevent bloat in your wp_options table, keeping it lean and fast.
Section 4.2: Supercharging Performance with Redis Object Caching
While transients are stored in the database, a true object cache takes this concept to the next level by storing data in a much faster location: RAM.
What is Redis?
Redis is an open-source, advanced, in-memory key-value store. When used with WordPress, it acts as a highly efficient and persistent object cache. “Persistent” means that unlike some other caching methods, the cache survives between page loads. It creates a semi-permanent layer of cached data that lives in your server’s RAM .
How Redis Works with WordPress
When a persistent object cache like Redis is enabled, the entire flow of data retrieval changes:
- A user requests a page, and WordPress needs some data (e.g., site options, navigation menus, the results of a
WP_Query). - Instead of immediately querying the MySQL database, WordPress first asks Redis: “Do you have the data for this key?”
- Cache Hit: If Redis has the data in RAM, it returns it almost instantly. The MySQL database is never touched. This is extremely fast.
- Cache Miss: If Redis does not have the data, WordPress proceeds as normal, querying the MySQL database. Once it gets the result, it stores a copy in Redis for future requests before sending it to the user.
This process dramatically reduces the number of read queries hitting your primary database, freeing up its resources to handle essential write operations and significantly improving your site’s TTFB and overall scalability.
When Do You Need Redis?
Redis is not a magic bullet for every site. Its benefits are most pronounced under specific conditions :
- Dynamic, High-Traffic Sites: This is the primary use case. WooCommerce stores, BuddyPress/bbPress forums, LearnDash/LMS sites, and membership sites generate a huge number of database queries that cannot be handled by standard page caching because the content is personalized for each logged-in user. Redis excels here.
- High Database CPU Usage: If your hosting analytics show that your database is consistently a resource bottleneck, Redis can provide immediate relief.
- Scaling for Concurrency: If your site experiences sharp traffic spikes where many users are accessing it simultaneously, Redis helps the server handle the load without choking the database.
For a simple blog with mostly static content that is already well-served by a good page caching plugin, the added complexity of Redis may not yield a noticeable improvement.
Implementation and Benchmarks
The easiest way to implement Redis is to choose a managed WordPress host that offers it as a one-click add-on. This handles the server installation and configuration for you. For those on a VPS, the process involves installing Redis on the server, installing the appropriate PHP extension (e.g., `php-redis`), and then using a plugin like Redis Object Cache to connect WordPress to the Redis server.
The performance gains can be substantial, but they are part of a layered caching strategy. Benchmarks from WPX.si show how different caching layers contribute to performance. While Redis object caching alone provides a modest boost on a fast database, its true power is unlocked when combined with other server-level optimizations like PHP’s opCache for uncached, dynamic pages.
| Caching Method | Avg. TTFB (ms) | Requests/sec | Performance Gain vs. Base |
|---|---|---|---|
| Base (No Cache) | 1250 | 9.29 | – |
| WP Object Cache (Redis) | 1183 | 9.55 | ~5% (on a fast DB) |
| PHP opCache | 343 | 34.34 | ~270% |
| opCache + Redis (for dynamic pages) | 328 | 35.92 | ~280% |
| FastCGI (Page Cache for static pages) | 5 | 1097.29 | ~11,700% |
Part 5: Choosing Your Optimization Path: A Practical Framework
With a deep understanding of diagnostics, query tuning, indexing, and advanced caching, the final step is to synthesize this knowledge into a practical strategy. Not every site needs every optimization. Applying the right techniques based on your site’s specific type, scale, and technical resources is key to achieving the best return on your effort. This framework provides clear, actionable guidance to help you choose the right path.
Use the following matrix to identify the most critical optimization strategies for your WordPress site. Find the row that best describes your website and use the columns to build your action plan.
The WordPress Database Optimization Matrix
| Site Type | Routine Cleanup (Low Effort, High Impact) |
Query/Index Tuning (Medium/High Effort, Critical for Scale) |
Caching Strategy (Varies by Site Type) |
|---|---|---|---|
| Personal Blog / Brochure Site Low traffic, mostly static content. |
Use a plugin like WP-Optimize or WP-Sweep monthly to clear revisions, spam, and trashed items. Check autoloaded data size annually. | Generally not required unless a specific plugin is causing noticeable slowness (diagnose with Query Monitor). | A standard page caching plugin (e.g., WP Rocket, W3 Total Cache) is sufficient. Object caching is overkill. |
| High-Traffic Content Site / Magazine High traffic, frequent publishing, many authors. |
Schedule weekly automated cleanups with a premium plugin. Pay close attention to cleaning expired transients. | Periodically use Query Monitor to spot-check slow queries, especially after installing new plugins. Focus on queries related to archives, search, and popular posts. | High-quality page caching is essential. Regularly cleaning transients is important. Redis can be beneficial if TTFB is high on uncached pages. |
| WooCommerce Store Transactional, dynamic content, large `wp_postmeta` table. |
Schedule daily or weekly automated cleanups. Focus on clearing WooCommerce transients and session data. | Critical. Regularly audit slow queries related to product filtering, orders, and user accounts. Adding indexes to wp_postmeta for product attributes (e.g., `_price`, `_sku`) is often necessary. |
Redis Object Caching is highly recommended to handle the high volume of un-cacheable, dynamic requests (cart, checkout, my-account). Use page caching for static pages like the homepage and product categories. |
| Membership / LMS Site Many logged-in users, protected content, progress tracking. |
Schedule daily or weekly cleanups. Focus on transients related to user sessions and course progress. | Critical. Audit queries related to user data, access rights, and course/lesson retrieval. Indexing wp_usermeta and any custom tables from your LMS or membership plugin is vital. |
Redis Object Caching is essential. Page caching is largely ineffective for logged-in users, making a persistent object cache the primary tool for ensuring a fast experience. |
| Custom Web Application on WordPress Bespoke functionality, heavy use of custom tables and APIs. |
Implement custom cleanup scripts or rely on scheduled plugin runs. The focus depends on what kind of temporary data your application generates. | Mandatory. All custom queries must be written with performance in mind and analyzed with EXPLAIN. All custom tables must be properly indexed from the start as part of the development process. |
Redis or another in-memory cache (like Memcached) should be considered a baseline requirement, not an optimization. It’s part of the core application architecture. |
Conclusion: From Bloated to Blazing-Fast
We’ve journeyed deep into the heart of WordPress performance, moving far beyond surface-level fixes to the very core of what makes a website fast and scalable. This report has established that effective database optimization is not about finding a single magic plugin, but about embracing a methodical, multi-layered strategy: Diagnose with tools like Query Monitor, Tune with `EXPLAIN` and efficient `WP_Query` practices, Index critical tables like `wp_postmeta` via phpMyAdmin, and Cache intelligently with transient management and persistent object caching like Redis.
A lean, responsive, and efficient database is the bedrock of a high-performing digital presence. It directly translates to a superior user experience, which in turn fosters higher engagement, boosts conversion rates, and strengthens your authority in the eyes of search engines like Google. By investing in the health of your database, you are not just speeding up a website; you are building a more resilient, reliable, and profitable online asset.
The path forward is clear. The techniques and frameworks outlined here provide a definitive roadmap for taking control of your site’s performance.
For the Hands-On Site Owner or Developer: Your first step is simple and immediate. Install the Query Monitor plugin. Spend just one day observing your site’s database activity as you navigate both the front-end and back-end. The insights you gain—the slow queries, the plugin culprits, the duplicate requests—will be the starting point for transforming your site’s performance from the inside out.
For the Business Owner Focused on Growth: If manual query tuning, server configuration, and `EXPLAIN` analysis feel overwhelming, don’t let your site’s performance—and your bottom line—suffer. A slow database is a silent conversion killer. Our team of WordPress experts specializes in advanced, enterprise-level database optimization. Contact us today for a comprehensive performance audit and let us unlock your website’s true potential, ensuring it’s built to handle your success.
Frequently Asked Questions (FAQ)
Is it safe to optimize my WordPress database?
It is safe if done correctly. Using reputable plugins like WP-Optimize for cleanup is generally low-risk. Manual operations like running SQL queries or adding indexes carry higher risk. The golden rule is to always create a complete, downloadable backup of your site and database before making any changes. Reputable hosts offer one-click backups, and plugins like Duplicator can create a full site archive .
How often should I clean my WordPress database?
It depends on your site’s activity. A small, personal blog might only need a monthly cleanup. A busy WooCommerce or membership site, however, generates significant transient data and can benefit from weekly or even daily automated cleanups to maintain optimal performance .
Will Redis speed up every WordPress site?
Not always. Redis provides the most significant benefit to sites with high, un-cacheable database load—dynamic sites like e-commerce stores, online forums, or LMS platforms where content is personalized for logged-in users. For a simple, static blog that is already well-served by full-page caching, the performance improvement from Redis might be minimal and not worth the added complexity.
Can I add database indexes without knowing SQL?
While the phpMyAdmin interface for adding an index is graphical, understanding *which* columns to index requires some technical analysis (gained from tools like Query Monitor and EXPLAIN). For a safer, less technical approach, you can try a plugin like “Index WP MySQL For Speed,” which is designed to add a set of proven, non-destructive indexes to common WordPress tables, particularly `wp_postmeta`, to improve performance on many sites .
What’s the difference between cleaning and optimizing a database?
Cleaning is like decluttering: it involves removing unnecessary data like old post revisions, spam comments, trashed items, and expired transients to reduce the overall size of the database. Optimizing is about improving the efficiency of the database structure itself. This includes re-organizing the data within tables to eliminate fragmentation (e.g., running an OPTIMIZE TABLE command) and adding indexes so that the remaining data can be accessed much faster. A complete strategy involves both cleaning and optimizing.

With over 27 years of hands-on SEO expertise, starting from my early days as a CFO. Quitting that job to build a top-ranked web hosting business in 1995, I’ve mastered WordPress optimization as a precise engineering discipline. Through extensive research, high-level consulting, and developing a WordPress site that achieved over a thousand organic Google rankings—culminating in a six-figure sale—I’ve decoded Google’s algorithm over 27 years to develop wordpress engineering that transforms underperforming WordPress sites into authoritative powerhouses. Business owners frustrated by stagnant traffic, low visibility, and missed opportunities find relief as I help them deliver measurable ROI through higher rankings, increased leads, and sustainable growth. As owner of dominant city-based SEO platforms in major U.S. markets, I outperform industry gurus, empowering entrepreneurs, local businesses, agencies, and marketers via my WordPress Optimization services at wordpressoptimization.com to unlock their site’s full potential.